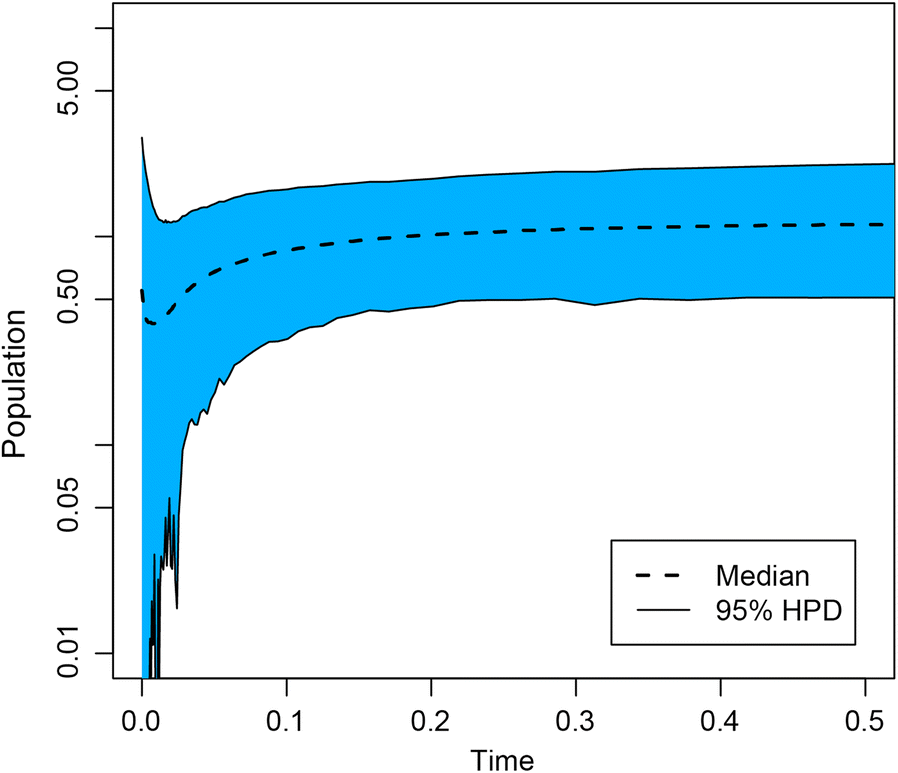
Fig. 5

Extended Bayesian skyline plot illustrating the entire posterior distribution of demographic trends for T. terrestris isolates employed in this study. Dashed lines are the median effective population sizes, whereas the solid ones belong to 95% HPD limits. The time is in units of million years before present and population uses a logarithmic scale (Log 4Neµ)