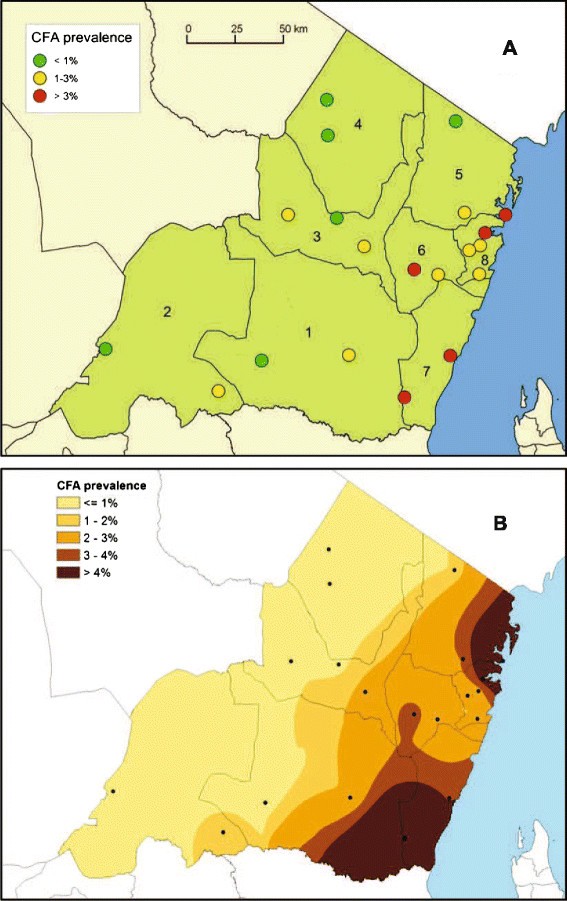
Figure 5

Map of Tanga Region showing circulating filarial antigen (CFA) prevalence in primary school children in 2013. A = measured prevalence levels at the survey sites. B = Prevalence isolines prepared by Bayesian kriging on the empirical data. Numbers indicate districts: 1 = Handeni, 2 = Kilindi, 3 = Korogwe, 4 = Lushoto, 5 = Mkinga, 6 = Muheza, 7 = Pangani, 8 = Tanga.